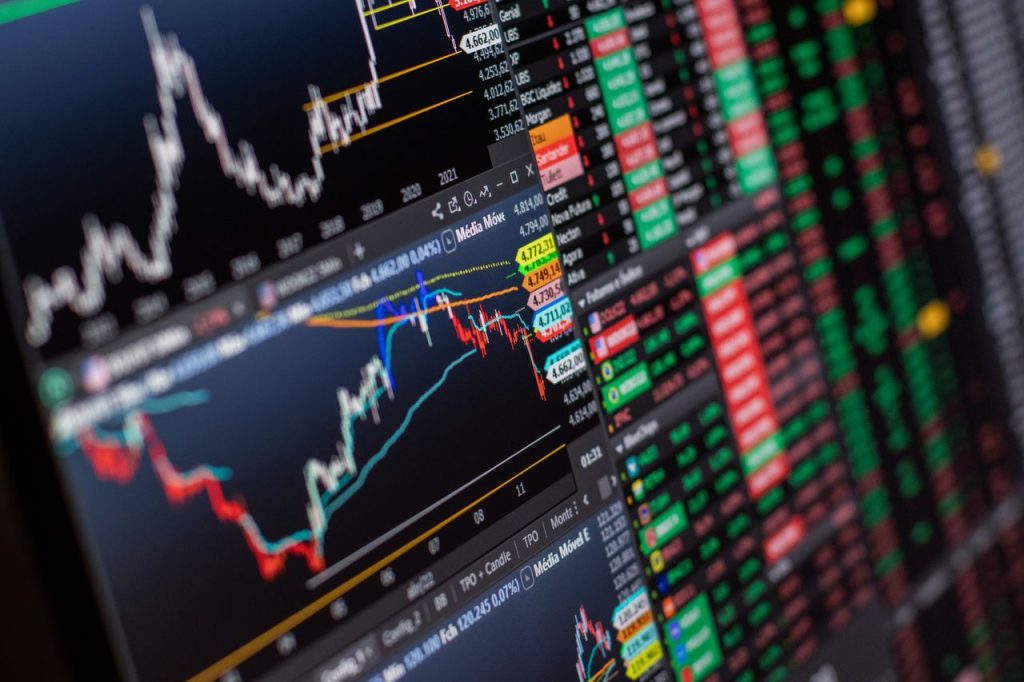
Copy trading is one of the most powerful features on modern platforms like Elites FX Edge. It allows you to automatically mirror the moves of seasoned market veterans across stocks, forex, and crypto, essentially putting your capital on autopilot.
But there is a dangerous trap on almost every social trading leaderboard: The ROI Illusion.
It is incredibly easy to get blinded by a headline Return on Investment (ROI) of +1,200%. However, a massive return often hides reckless risk-taking, over-leveraging, or a strategy that is one bad day away from wiping out your entire account. To protect your capital, you must act like a venture capitalist auditing a fund manager.
Before you click “Copy,” look past the raw profit and analyze these three critical risk-adjusted metrics.
1. Maximum Drawdown (The “Pain Tolerance” Metric)
If ROI tells you how much a trader makes when they are right, Maximum Drawdown (MDD) tells you how bad it gets when they are wrong. MDD measures the largest peak-to-trough drop in a trader’s account balance before a recovery.
Account Equity
  ▲
  │      Peak ($10,000)
  │        ┌───┐
  │       ─┘   └───┐
  │                └───┐ <─── Drawdown Area (30% Decline)
  │                    └───┐
  │                        └───┐ Trough ($7,000)
  └────────────────────────────────────────────────► Time
- Why it matters: If a trader has an ROI of 150% but a Maximum Drawdown of 65%, it means that at some point, their account was bleeding more than half its value. If you had started copying them right at their peak, your capital would have been cut by 65% before seeing a recovery.
- The Benchmark: Look for Master Traders who keep their MDD under 20% to 25%. Anyone with a drawdown exceeding 40% is playing a highly aggressive, high-leverage game that could easily blow up your portfolio.
2. The Profit Factor (Efficiency Over Luck)
The Profit Factor is a simple ratio that cuts through the noise of lucky streaks. It is calculated by dividing total gross profits by total gross losses over a specific period.
$$\text{Profit Factor} = \frac{\text{Total Gross Profits}}{\text{Total Gross Losses}}$$
- Why it matters: A trader can have an impressive 85% win rate, but if their few losing trades are massive, they are actually losing money overall. The Profit Factor tells you exactly how efficient a strategy is. If a trader made $15,000 on winning setups and lost $10,000 on losing setups, their Profit Factor is 1.5.
- The Benchmark:
- Below 1.0: The trader is actively losing money. Avoid.
- 1.1 to 1.4: Moderately profitable, but running on thin margins.
- 1.5 to 2.0+: Highly efficient. This means the trader generates significantly more dollars on their wins than they give back on their losses.
3. Account Age & Trade Frequency (The Longevity Test)
Anyone can have a spectacular month in a raging crypto bull market or a massive tech-sector rally. True trading elite are proven across multiple market environments.
- Why it matters: Be suspicious of any Master Trader with an account history shorter than 3 to 6 months. You need to see how they handle changing market dynamics—sideways consolidation, sudden interest rate spikes, or liquidity flushes.
- The Sizing Clue: Look at their transaction history for consistency in position sizing. If a trader usually risks 1% per trade, but suddenly risks 15% after a loss, they are “revenge trading” to recover funds emotionally. This is a massive red flag.
Summary Leaderboard Cheat Sheet
When auditing master profiles on the dashboard, weigh these metrics against each other to find your ideal risk match:
| Performance Profile | Target ROI | Acceptable Max Drawdown | Ideal Profit Factor | Track Record Age |
| Conservative (Multi-Asset) | 15% – 30% | Under 15% | 1.8+ | 6+ Months |
| Moderate (Equities + FX focus) | 35% – 60% | 15% – 25% | 1.5 – 1.8 | 6+ Months |
| Aggressive (Crypto Derivatives) | 80%+ | 25% – 40% | 1.2 – 1.5 | 3+ Months |
The Bottom Line
The ultimate copy-trading edge isn’t finding the person who makes the most money in a single week; it’s finding the person who exposes your capital to the least amount of risk while achieving steady, incremental growth. By prioritizing low drawdowns and a high profit factor on your Elites FX Edge dashboard, you can build a genuinely stable, hands-free stream of passive wealth.